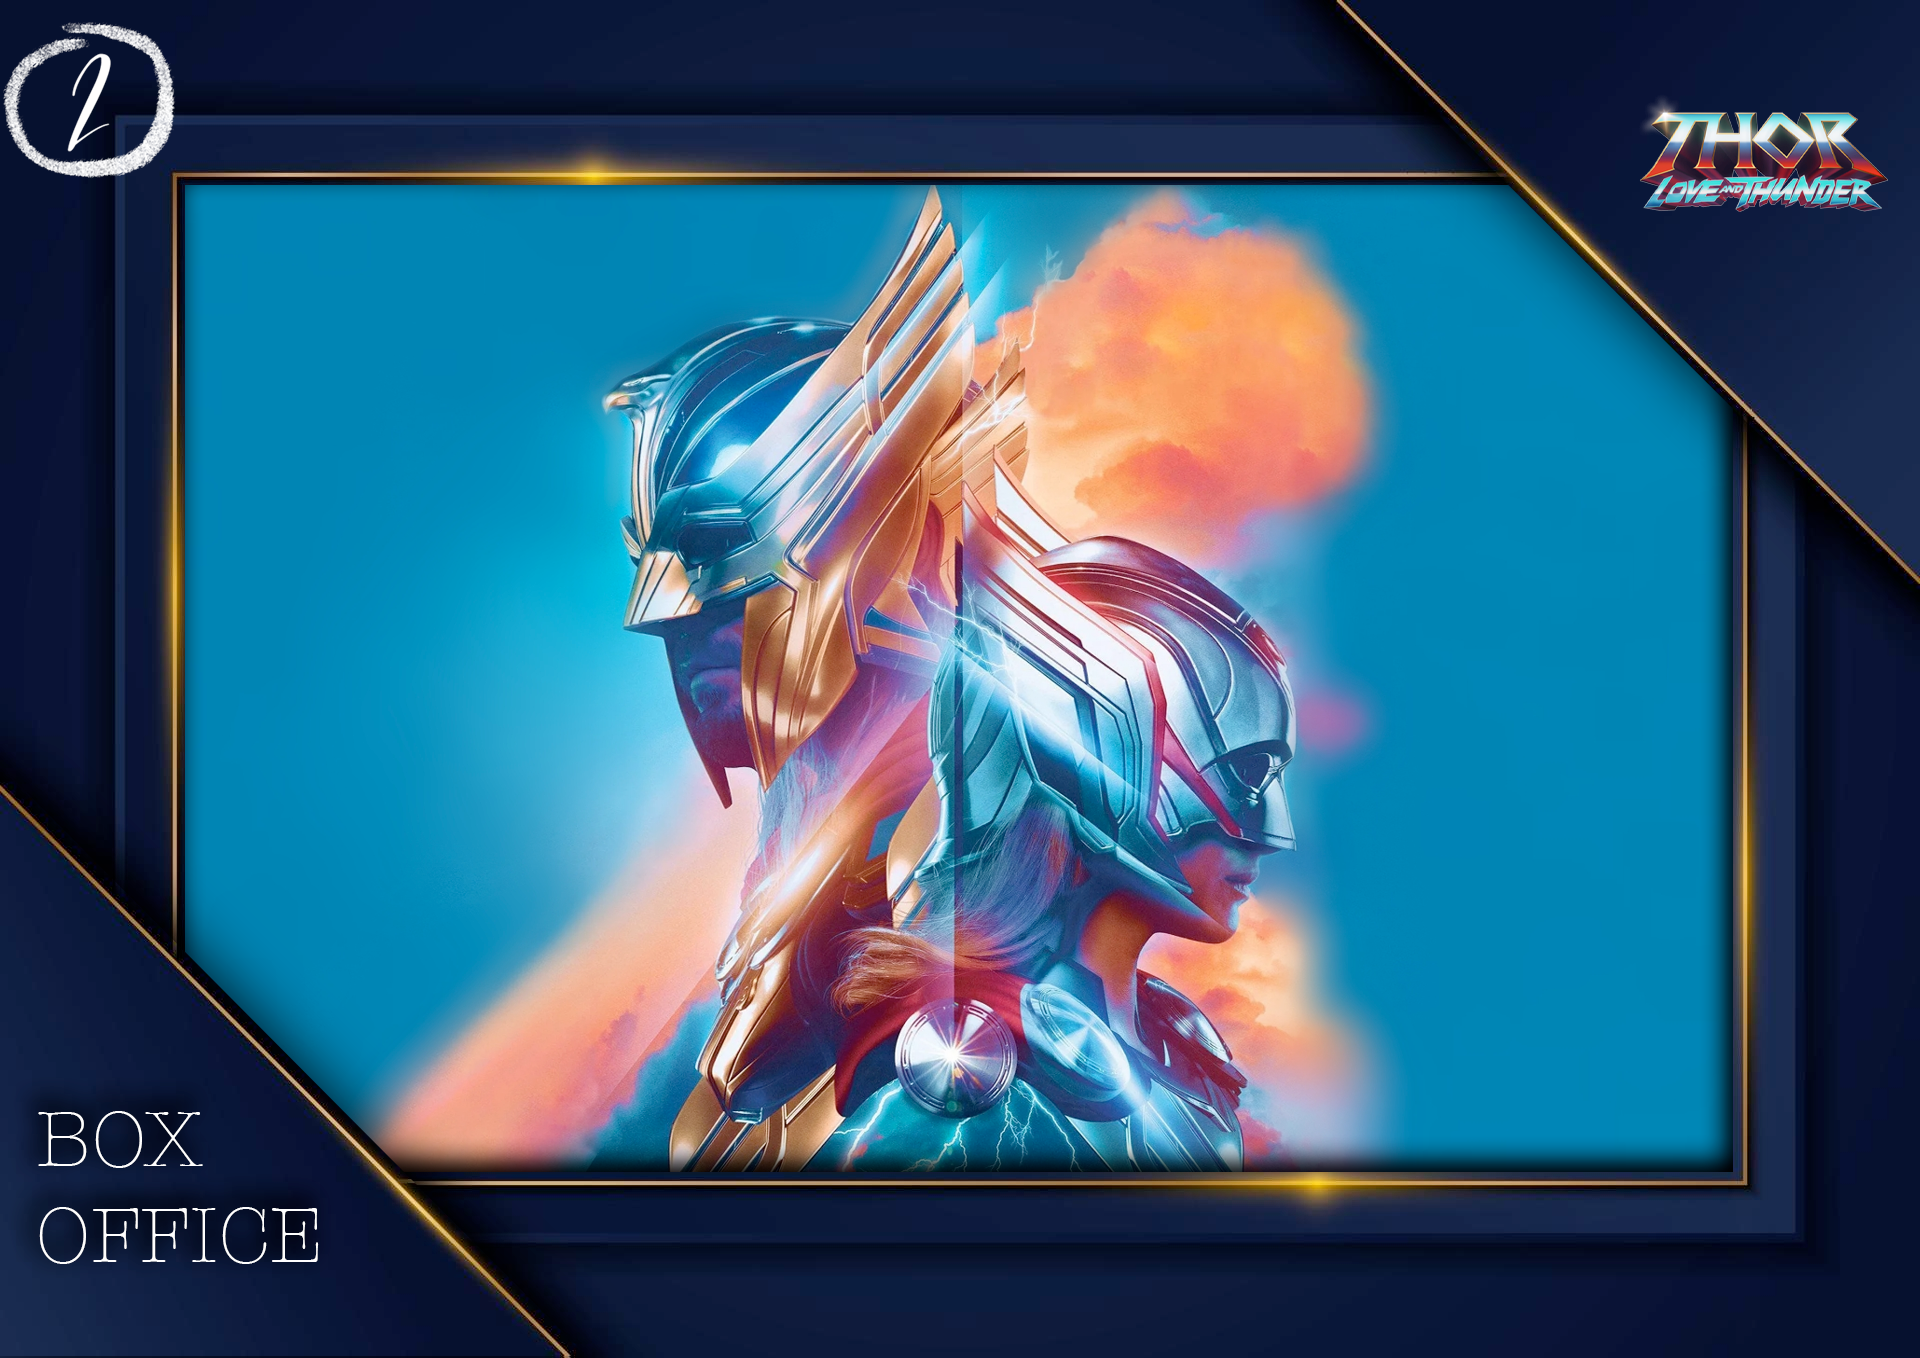


July 15-17, 2022
BIGGEST WEEKEND:
“THOR: LOVE AND THUNDER”
$46,632,172
RUNNER-UP:
“Minions: The Rise of Gru”
$26,838,560
BIGGEST PER THEATER AVERAGE:
“THOR: LOVE AND THUNDER”
$10,658 per 4,375 THEATERS
BIGGEST PERCENTAGE INCREASE:
“Relative”
+258.9%
THIS TIME LAST YEAR (2021):
“Black Widow”
$80,366,312
NEXT WEEKEND:
“NOPE”
PROJECTED: $40-60 MILLION
#
TITLE
GROSS
TOTAL
BUDGET
STUDIO
WK
LW
+/-
| 1 |
| 2 |
| 3 |
| 4 |
| 5 |
| 6 |
| 7 |
| 8 |
| 9 |
| 10 |
| 11 |
| 12 |
| 13 |
| 14 |
| 15 |
| 16 |
| 17 |
| 18 |
| 19 |
| 20 |
| 21 |
| 22 |
| 23 |
| 24 |
| 25 |
| “Thor: Love and Thunder” |
| $46,632,172 |
| $233,903,308 | $250m | Walt Disney |
| 2nd | #1 |
| “Minions: The Rise of Gru” |
| $26,838,560 |
| $263,406,065 | $80m | Universal |
| 3rd | #2 |
| “Where the Crawdads Sing” |
| $17,253,227 |
| $17,253,227 | $24m | Sony Pictures |
| 1st | — |
| “Top Gun: Maverick” |
| $12,268,764 |
| $618,231,332 | $152m | Paramount |
| 8th | #3 |
| “Elvis” |
| $8,000,873 |
| $106,601,284 | $85m | Warner Bros. |
| 4th | #4 |
| “Paws of Fury: The Legend of Hank” |
| $6,312,060 |
| $6,312,060 | $45m | Paramount |
| 1st | — |
| “The Black Phone” |
| $5,372,505 |
| $72,108,680 | $18m | Universal |
| 4th | #6 |
| “Jurassic World: Dominion” |
| $5,152,400 |
| $359,911,400 | $185m | Universal |
| 6th | #5 |
| “Mrs Harris Goes to Paris” |
| $1,953,070 |
| $1,953,070 | — | Focus Features |
| 1st | — |
| “Lightyear” |
| $1,400,546 |
| $115,599,296 | $200m | Walt Disney |
| 5th | #7 |
| “Marcel the Shell with Shoes On” |
| $567,918 |
| $1,688,365 | — | A24 |
| 4th | #8 |
| “Everything Everywhere All at Once” |
| $147,066 |
| $67,930,576 | $25m | A24 |
| 17th | #11 |
| “Gone in the Night” |
| $123,833 |
| $123,833 | — | Vertical |
| 1st | — |
| “The Bad Guys” |
| $90,245 |
| $96,559,005 | $80m | Universal |
| 13th | #12 |
| “Doctor Strange Multiverse of Madness” |
| $81,840 |
| $411,206,611 | $200m | Walt Disney |
| 11th | #10 |
| “Gabby Giffords Won’t Back Down” |
| $75,124 |
| $75,124 | — | Briarcliff |
| 1st | — |
| “The Bob’s Burgers Movie” |
| $67,882 |
| $31,885,568 | $70m | 20th Century |
| 8th | #13 |
| “Fire of Love” |
| $64,813 |
| $118,974 | — | Neon |
| 2nd | #19 |
| “The Killer” |
| $49,814 |
| $71,910 | — | Wide Lens |
| 1st | — |
| “Fire” |
| $40,952 |
| $71,298 | — | IFC Films |
| 2nd | #20 |
| “Hallelujah: Leonard Cohen” |
| $36,612 |
| $136,526 | — | Sony Pictures |
| 3rd | #16 |
| “Official Competition” |
| $27,311 |
| $530,201 | — | IFC Films |
| 5th | #14 |
| “Mr. Malcolm’s List” |
| $25,251 |
| $1,848,784 | — | Bleeker Street |
| 3rd | #9 |
| “The Phantom of the Open” |
| $13,597 |
| $689,753 | — | Sony Classics |
| 7th | #18 |
| “Mad God” |
| $11,408 |
| $240,874 | — | IFC Films |
| 6th | #21 |
VACATED THE LIST


TITLE
DOMESTIC
WORLD
BUDGET
STUDIO
WK
HI
($$)
| “Dreaming Walls: Inside the Chelsea Hotel” |
| $16,728 |
| $16,728 | — | Magnolia Pictures |
| 2nd | #24 |
| “The Forgiven” |
| $325,198 |
| $325,198 | — | Roadside Attractions |
| 3rd | #15 |
| “Fourth of July” |
| $333,273 |
| $333,273 | — | Circus King |
| 3rd | #12 |
| “Lost Illusions” |
| $105,666 |
| $8,579,592 | — | Music Box |
| 6th | #23 |
| “Murina” |
| $26,232 |
| $369,369 | — | Kino Lorber |
| 2nd | #25 |
| “Uncharted” |
| $148,648,820 |
| $401,748,820 | $120m | Sony Pictures |
| 21st | #1 |

![Retrospective: July 2026 in Review [Updated on July 24]](https://nobadmovie.com/wp-content/uploads/2026/07/odyssey_070226_image001.png)

Leave a Reply